How to Measure Port Performance for Actionable Insights (2026 Guide)
Why traditional port KPIs fall short in measuring true port performance
Traditional port performance indicators (such as berth productivity, dwell time, and throughput per berth) only scratch the surface of how efficiently a port truly operates. These metrics often ignore what happens outside the berth: vessel waiting, shifting, and idle periods that can consume as much time as loading or discharging cargo.
In complex port environments, especially liquid bulk and tanker ports, performance gaps often emerge between scheduled and actual operations. To gain actionable insights, ports must evaluate the entire operational chain of a vessel call from approach to departure, and connect inefficiencies directly to operational, commercial, and environmental outcomes.
Start with a holistic definition of port performance
A high-performing port defines port performance from the vessel’s perspective. Instead of focusing solely on berth-side productivity, a robust framework includes every step from the vessel’s arrival at the port area until its departure.
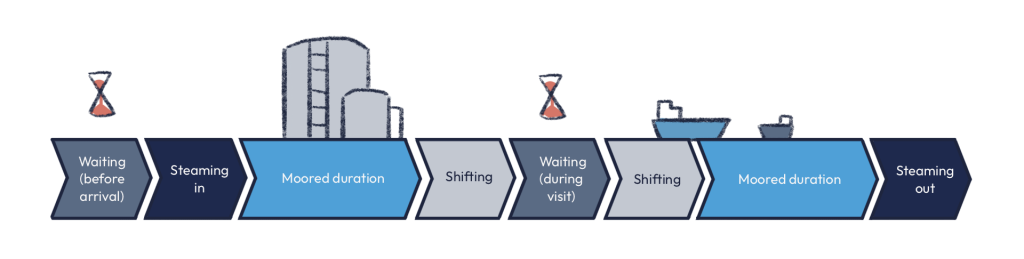
Port Turnaround Time (PTT) is a comprehensive metric that captures the entire vessel visit cycle, including:
- Waiting before arrival (anchorage or drifting)
- Pilot boarding and inbound transit
- Berthing and cargo operations
- Intra-port shifting between berths
- Waiting during the visit
- Outbound transit and departure
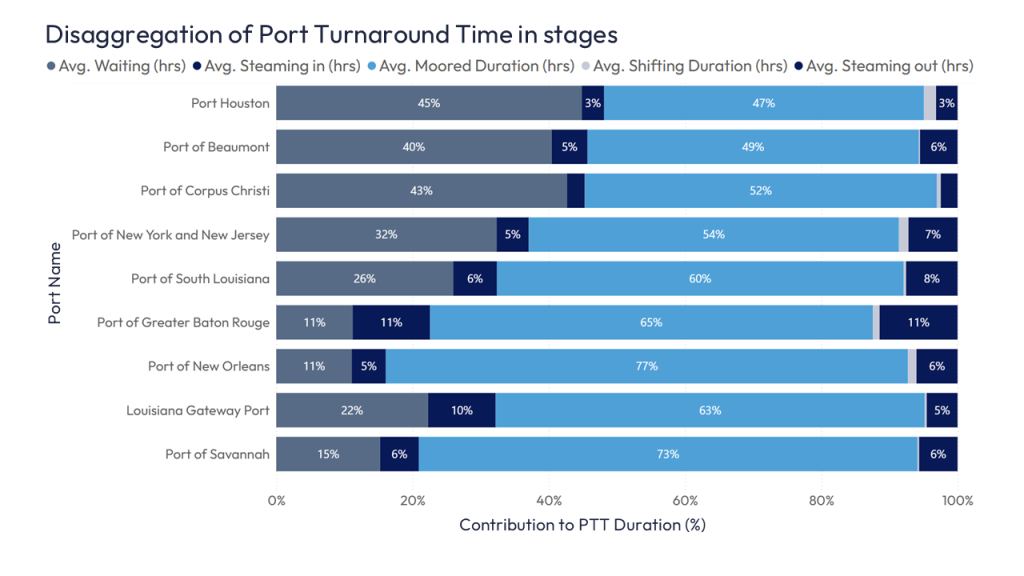
By measuring the entire port visit, PTT highlights inefficiencies that traditional berth or dwell-time metrics overlook. A benchmark report on U.S. tanker ports reveals that productive berth time may represent only ~40-70% of total turnaround time, with the rest lost to waiting and shifting.
This holistic approach ensures port authorities, terminal operators, and shipping lines share a unified performance view that aligns operational and commercial goals.
Disaggregate port performance to identify root causes
A single average PTT value provides only a headline. To make port performance insights actionable, the data must be disaggregated into specific components.
Key diagnostic questions include:
- How much time is spent waiting before arrival versus during the visit?
- What proportion of total time is lost to intra-port shifting?
- How often are vessels idle while moored?
A benchmark report on parcel tankers in U.S. Gulf ports shows that pre-arrival waiting alone can average 30-50 hours per call, even where infrastructure is modern. In parcel tanker operations, waiting between multiple berths can exceed pre-arrival waiting, especially in complex multi-cargo calls.
Breaking PTT into measurable stages transforms raw data into actionable performance intelligence.
Benchmark port performance in context
Benchmarking only makes sense when comparing similar conditions. Effective port performance benchmarking requires segmentation by:
- Vessel class (e.g., MR, LR, VLCC)
- Cargo type (e.g., crude, chemical, LNG)
- Terminal configuration (e.g., offshore vs. riverine)
A port handling Very Large Crude Carriers (VLCCs) across distant energy terminals is hard to compare to a compact river port handling medium-range tankers.
Analyses show that the number of berths visited directly impacts PTT. Multi-berth calls often triple total turnaround time compared to single-berth visits, mostly due to non-productive waiting, not actual cargo operations.
Meaningful benchmarking allows ports to compare like with like, identifying where operational inefficiencies stem from structure versus management.
Translate port time into cost, fuel, and emissions
For performance metrics to drive decisions, time must translate into economic and environmental impact. Measuring hours without understanding their cost or emissions implications limits the usefulness of data.
By linking Port Turnaround Time (PTT) to:
- Charter or demurrage costs
- Fuel consumption during waiting and shifting
- CO2 emissions
Ports and stakeholders can quantify how inefficiencies affect profitability and sustainability.
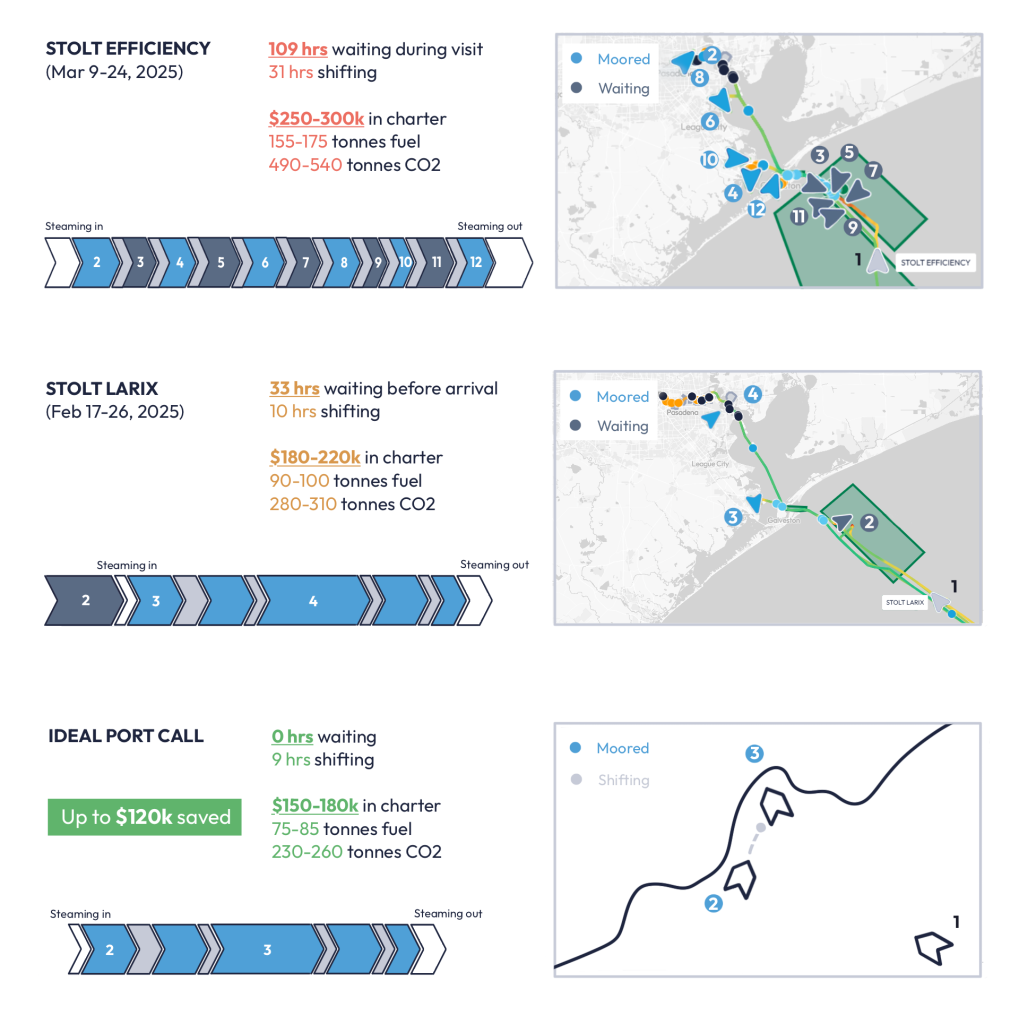
Benchmark reports indicate that reducing turnaround time by even one day for a medium-range tanker can save tens of thousands of dollars in charter costs, tons of fuel, and dozens of tonnes of CO2. The amount of savings can be enormous when scaled up to all the vessels and port calls that a port receives in a year.
Build resilience into port performance measurement
Port performance doesn’t exist in a vacuum. Disruptions such as weather events, tidal restrictions, and labor shortages will always occur.
Resilient ports measure variability as well as average performance to manage risk effectively. Tracking performance over time helps ports:
- Identify disruption trends
- Measure recovery speed
- Evaluate the success of mitigation strategies
Ports capable of quantifying how disruptions affect turnaround time are better positioned to justify investments in digitalization, flexibility, and collaborative planning tools.
From measurement to continuous improvement
Effective port performance measurement builds the foundation of continuous improvement.
The transformation involves:
- Adopting holistic metrics such as Port Turnaround Time.
- Disaggregating port calls into operational stages.
- Benchmarking appropriately against similar ports.
- Translating time losses into cost, fuel, and emissions data.
- Focusing on coordination and building resilience.
By integrating these principles, ports can evolve from data collection to data-driven decision-making, achieving measurable gains in efficiency, sustainability, and competitiveness.
In today’s environment of rising uncertainty, tighter margins, and sustainability pressures, the ports that measure what truly matters will be the ones best equipped to lead.
Conclusion: measuring what truly matters in port performance
Improving port performance requires shifting from traditional, siloed KPIs to holistic, vessel-centric analysis. By focusing on Port Turnaround Time, ports can uncover hidden inefficiencies, link them to financial and environmental impacts, and transform performance data into strategic insights.
Ports that adopt a comprehensive, data-driven approach to measurement are not only improving efficiency, they’re also strengthening their competitive edge in a rapidly evolving global trade environment.

Léon Gommans | CEO/Co Founder of Teqplay
A serial entrepreneur who’s passionate about #innovation, #technology, #collaboration, and of course, #maritime. The mission is: to connect the dots & to get it to work, together with the industry!
- +31 (0)6 55306660
- leon@teqplay.com
- Léon Gommans