Ports Benchmark Reveals Hidden Inefficiencies: Port of Rotterdam, Port of Amsterdam, and Port of Antwerp-Bruges
The Port of Rotterdam, Port of Amsterdam, and Port of Antwerp-Bruges form one of the world’s most important liquid bulk hubs. Together, they handle massive volumes of crude oil, refined products, chemicals, and LNG, making them critical to global energy flows.
However, the latest ARA ports benchmark shows that even in such advanced port systems, inefficiencies persist. Based on more than 25,000 tanker calls, the benchmark highlights how operational inefficiencies are primarily caused by something often less visible: waiting time .
This report will change how stakeholders should think about port performance, cost control, and emissions reduction.
Understanding port turnaround time (PTT) in ARA ports
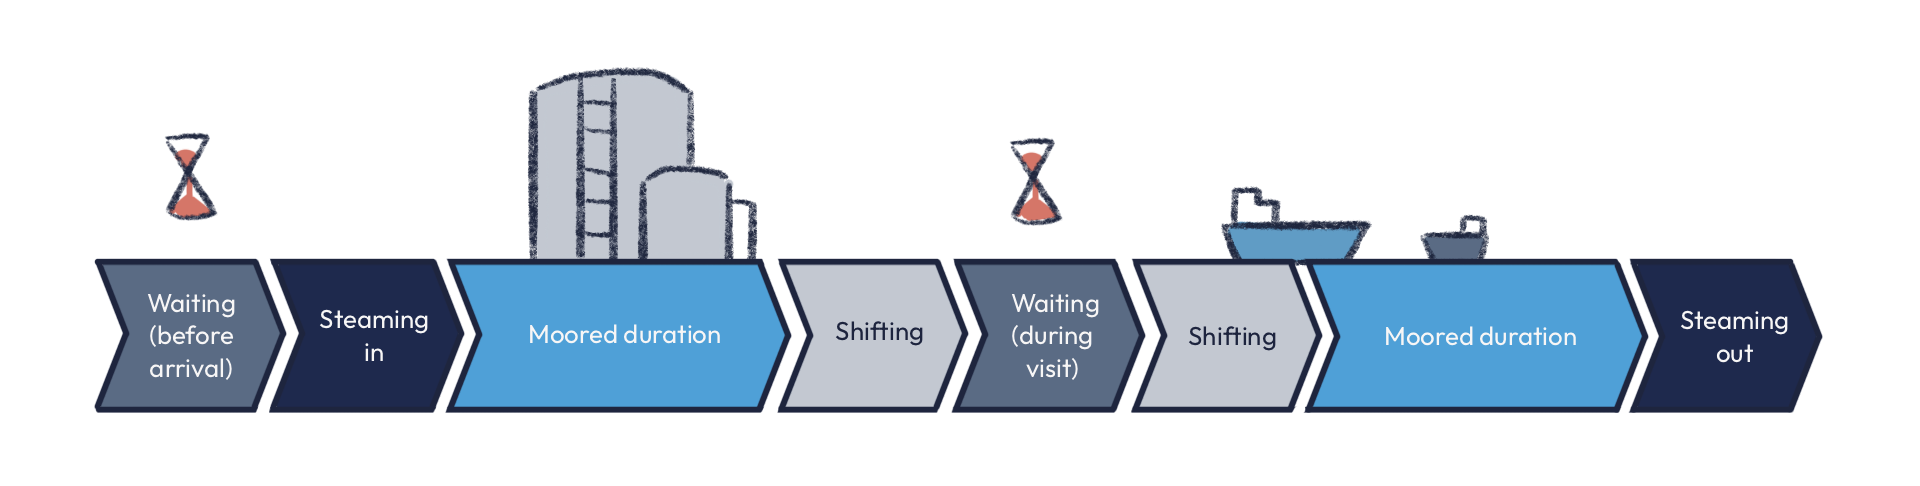
Port Turnaround Time (PTT) measures the full duration of a vessel’s port call, including:
- Waiting before arrival
- Steaming in and out
- Time alongside (moored duration)
- Shifting between berths
Unlike traditional berth-only metrics, PTT provides a complete picture of operational efficiency. When it comes to improving performance, it’s important to know how to measure the right port metrics correctly.
In general, the Port of Rotterdam consistently maintained the lowest turnaround times, while the Port of Amsterdam recorded the largest increase in recent times. The Port of Antwerp-Bruges remained relatively stable but showed vulnerability during disruptions.
Where time is lost in ARA ports operations
The benchmark reveals that waiting accounts for up to one-third of total port time. This makes it the single largest driver of inefficiency across the Port of Rotterdam, Port of Amsterdam, and Port of Antwerp-Bruges.
Even when berth productivity is similar, differences in waiting time create significant performance gaps between ports.
Waiting time is largely a coordination problem. It reflects how well vessel arrivals align with berth availability, terminal readiness, and nautical services. When synchronization fails, delays compound quickly, especially in a dense port cluster like ARA, where congestion in one port can spill over into others.
The cost of inefficiency
One case study in the Port of Amsterdam showed a tanker waiting 12 days before berthing. This resulted in:
- Charter costs between €580,000 and €750,000
- Fuel consumption of up to 200 tonnes
- CO2 emissions reaching 600 tonnes
A better-coordinated operation could have reduced turnaround time dramatically and saved up to €600,000 in a single port call.
These inefficiencies affect all stakeholders:
- Shipowners face higher charter exposure
- Terminals experience reduced effective capacity
- Ports deal with congestion and operational stress
Berth readiness: The key to reducing waiting time
The report highlights a critical insight: berth readiness at arrival is more important than average berth utilization. When vessels arrive and berths are occupied, waiting time more than doubles, often adding over 24 hours to the port call. Improving synchronization across the Port of Rotterdam, Port of Amsterdam, and Port of Antwerp-Bruges requires:
- Accurate ETA and ETD sharing
- Coordinated planning between terminals and vessels
- Adoption of Just-in-Time (JIT) arrival strategies
These changes can significantly reduce idle time and unlock hidden capacity.
How maritime stakeholders can use these insights
Ship owners and charterers: You can translate waiting and shifting directly into costs, fuel consumption, and emission, strengthening your position in negotiations and voyage planning decisions. You can initiate data-supported conversations to improve alignment on arrival strategies that prevent unnecessary idle days.
Terminals: Quantifying how coordination gaps reduce effective berth capacity can support decisions on scheduling improvements. This way, you can lower system-wide cost and increase customer satisfaction.
Port authorities: The benchmark helps identify whether inefficiencies stem from infrastructure constraints or operational misalignment. This creates the ground needed for conversations with stakeholders and prioritizing investments that deliver measurable impact.
Ultimately, this benchmark provides a neutral baseline that can be used in discussions among maritime stakeholders to quantify the cost of misalignment and agree on shared improvement targets.
Explore the full ARA ports benchmark report
To explore detailed insights on the Port of Rotterdam, Port of Amsterdam, and Port of Antwerp-Bruges, including performance comparisons, delay drivers, and cost-saving opportunities, access the full report below.
For more information about port performance analytics, you can also see https://www.teqplay.com/improve-performance

Léon Gommans | CEO/Co Founder of Teqplay
A serial entrepreneur who’s passionate about #innovation, #technology, #collaboration, and of course, #maritime. The mission is: to connect the dots & to get it to work, together with the industry!
- +31 (0)6 55306660
- leon@teqplay.com
- Léon Gommans