Exploring BI tools with Teqplay
Power BI, Tableau, Qlik, and QuickSight
At Teqplay, we believe that data is only powerful when it is backed by context and it leads to action. We collect and work with vast streams of maritime data, but without the right tools they remain just numbers. Business Intelligence (BI) platforms bridge that gap, turning complexity into clarity and insights into outcomes.
One example from our own operations is the use of Power BI to monitor port turnaround times. Teqplay dashboards provide layered perspectives: from high-level views of turnaround time across ports down to vessel-level activity and berth occupancy. With interactive drill-downs, stakeholders can move between strategic overviews and operational details, enabling faster detection of bottlenecks and more informed decisions. From these data and dashboards, we have created detailed port benchmark reports.
Building on this experience, Teqplay evaluated four leading BI tools: Power BI, Tableau, Qlik, and QuickSight, to compare their strengths, limitations, and rules of thumb for selecting the right tool for different scenarios.
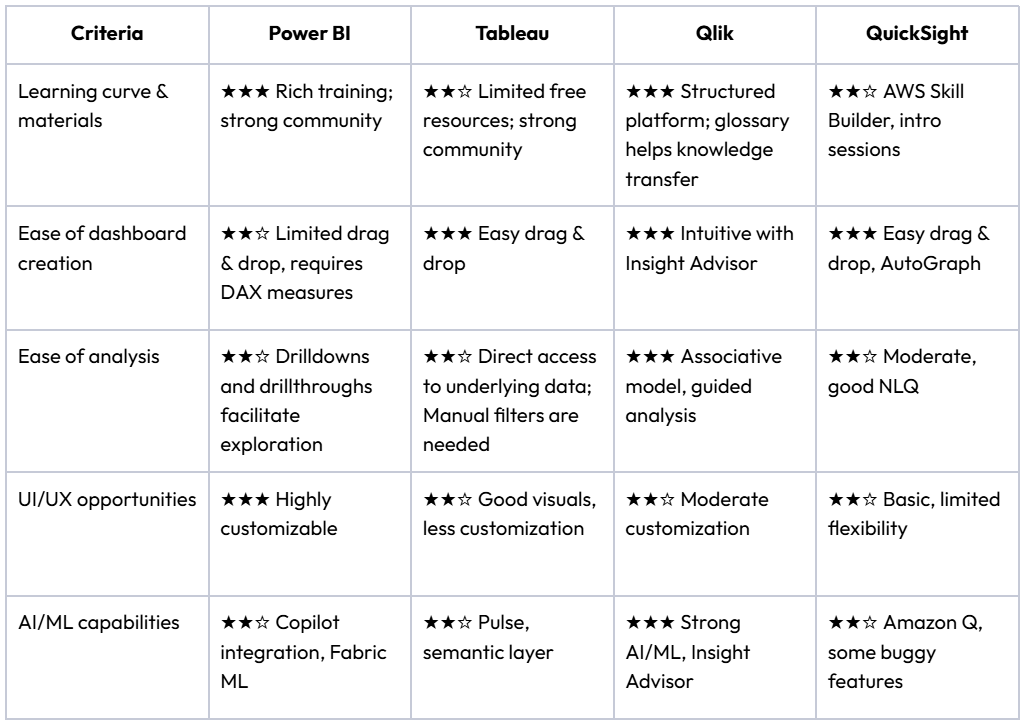
BI Tools Evaluation Criteria
The BI tools are evaluated through multiple lenses:
- Learning curve & materials
- Ease of dashboard creation
- Ease of analysis
- UI/UX opportunities
- AI/ML capabilities
Power BI
Strengths
- Highly customizable UI/UX (bookmarks, buttons, custom visuals)
- Rich training resources and strong community support
- Frequent monthly updates with consistent feature delivery
- Easy integration with the Microsoft ecosystem
Limitations
- Requires familiarity with measures (DAX); drag & drop limited for complex visuals
- Row/object-level security exists but feels unintuitive
- Scheduled refreshes limited to once per day unless upgraded
- Complicated pricing with Azure and Fabric subscriptions to enable AI/ML capabilities
When to Use
Great when advanced customization, governance and monitoring are priorities, especially for companies operating in Microsoft ecosystem.
Tableau
Strengths
- Great visual exploration and variety
- Quick access to underlying data
- Tableau Pulse and Data Guide attempt at integrating more AI/ML driven insights
- Strong community
Limitations
- Limited free training resources; Finding answers was sometimes difficult for beginner-level questions
- Cross-filtering requires manual setup for each interaction
- AI/NLQ (Pulse) only fully available in edit mode, and they require predefined variables
When to Use
Great when visual storytelling, exploration and direct access to underlying data matter most.
Qlik
Strengths
- Glossary helps establish a “single source of truth”
- Structured platform that offers walkthroughs
- Insight Advisor guides analysis and NLQ
- Frequent updates, strong focus on AI and automation
- Strong embedded analytics abilities
Limitations
- Some buggy experiences, especially with AI visuals
- Usage monitoring is limited, mainly showing number of views
When to Use
Great when guided exploration, AI-assisted analysis and embedded analytics are important
AWS QuickSight
Strengths
- Very cost-effective and transparent pricing
- NLQ (Amazon Q) supports agentic trend analysis, forecasting and solution exploration
- AutoGraph feature simplifies analysis for end users
- Cloud-native, with near-monthly updates
Limitations
- Interactivity is limited; many actions must be defined manually
- Some visuals lack smooth cross-filtering
- Governance and monitoring depend on extra AWS services (CloudWatch, DataZone)
- Some AI features are buggy; advanced ML requires higher tiers
When to Use
Great when cost and speed of deployment are valued more than advanced interactivity, especially suitable for AWS-first companies
BI Tools Comparison Summary
Power BI In Action With Teqplay
At Teqplay, Power BI is used to present insights to maritime stakeholders in the port and terminal context. We have also created various reports on U.S. ports thanks to these insights.
In this use case, the high customizability of the UI/UX and the ability to create and drill down into multiple views are essential.
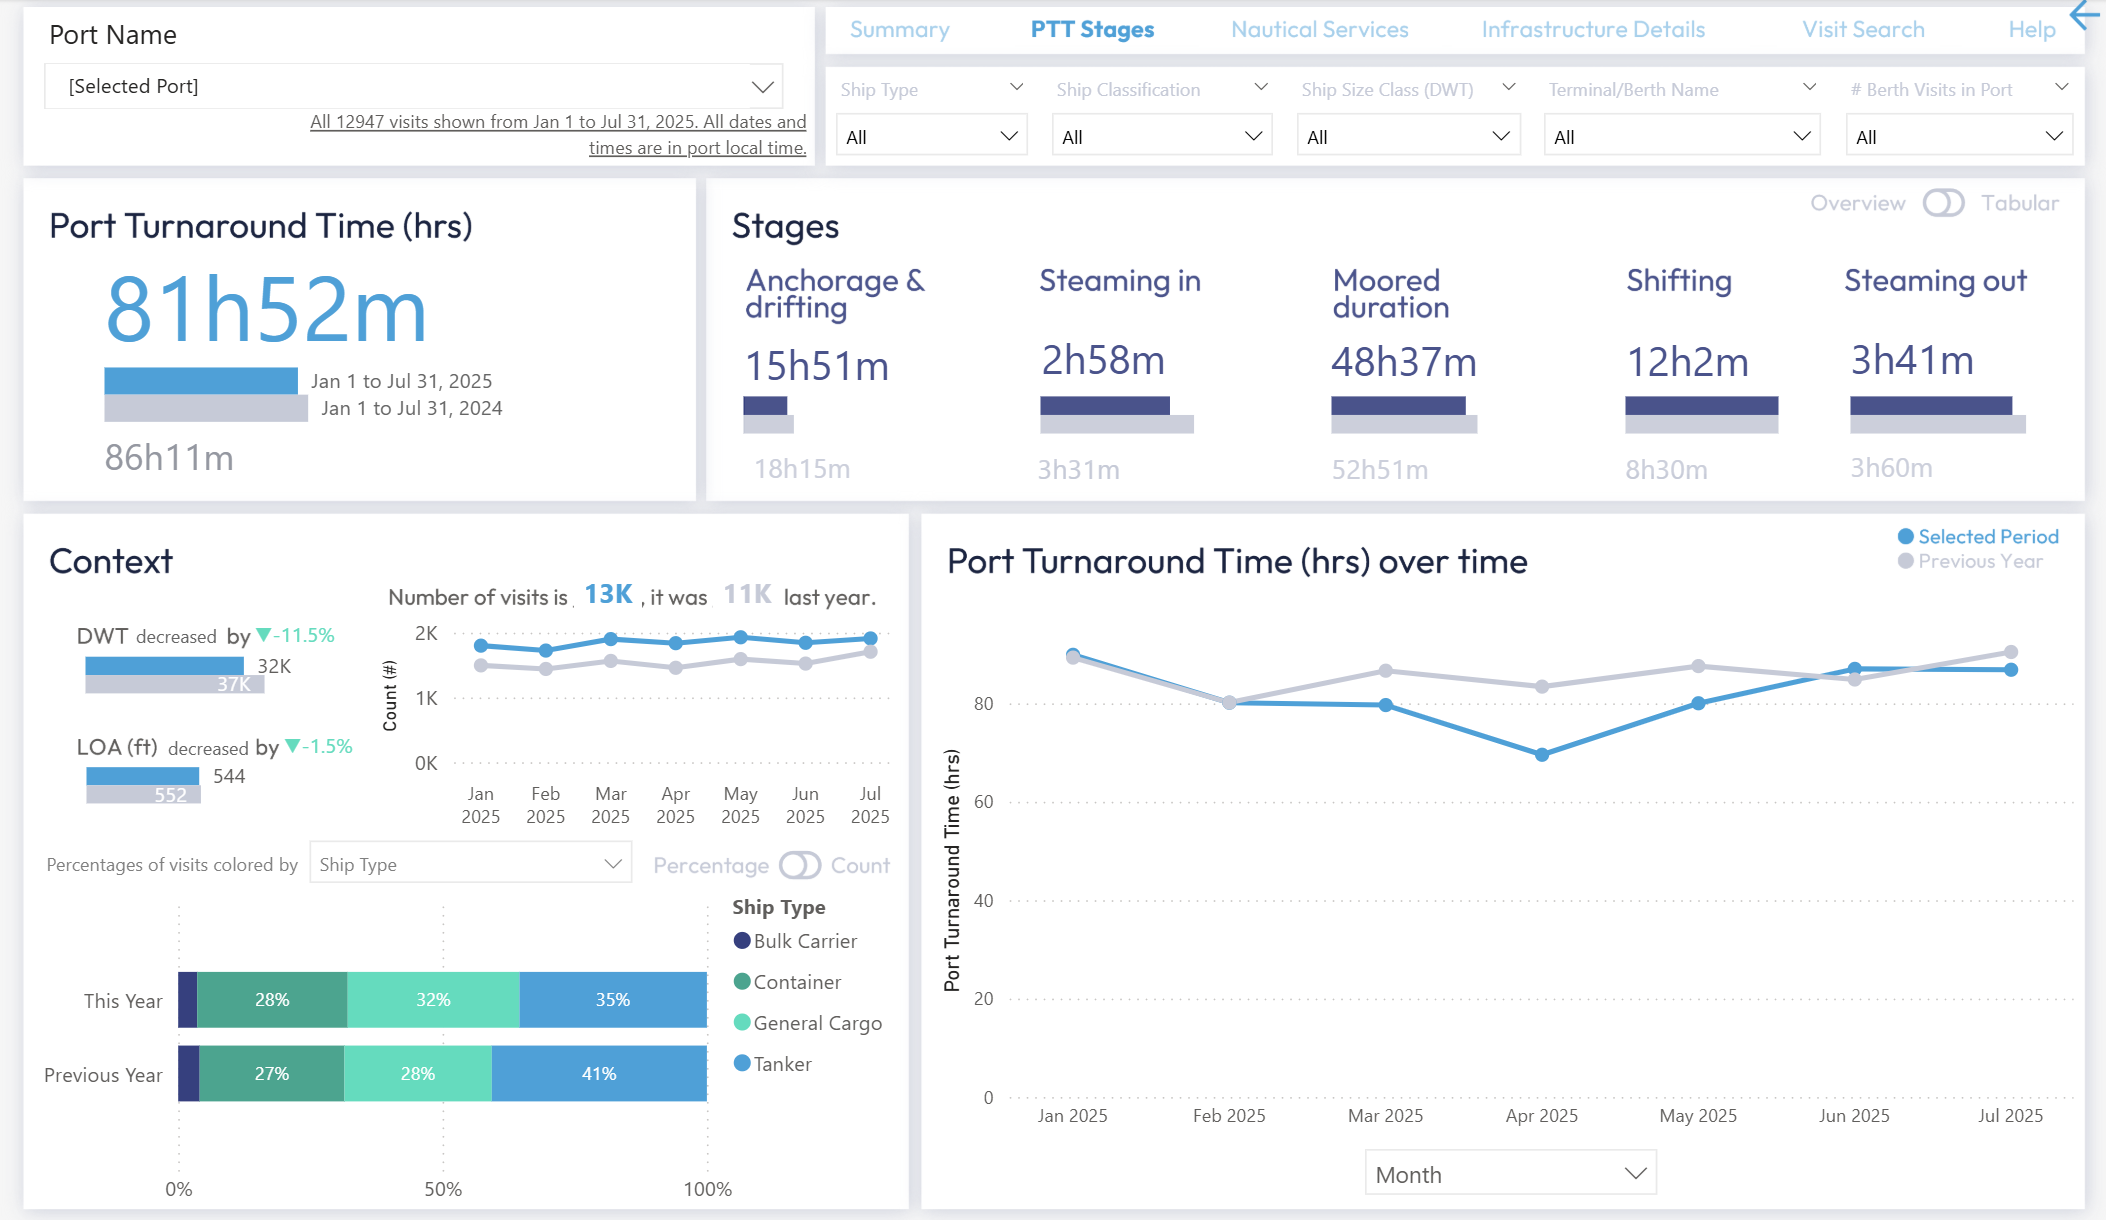
The dashboard above shows port turnaround time (PTT) insights for a port. Users can move from the overall PTT down into each stage: anchorage and drifting, steaming in and out, moored duration, and shifting.
The view below illustrates the anchorage and drifting stage, where waiting times for individual vessel calls are displayed. This drill-down is accessible by selecting the “Anchorage & drifting” stage on the main dashboard.
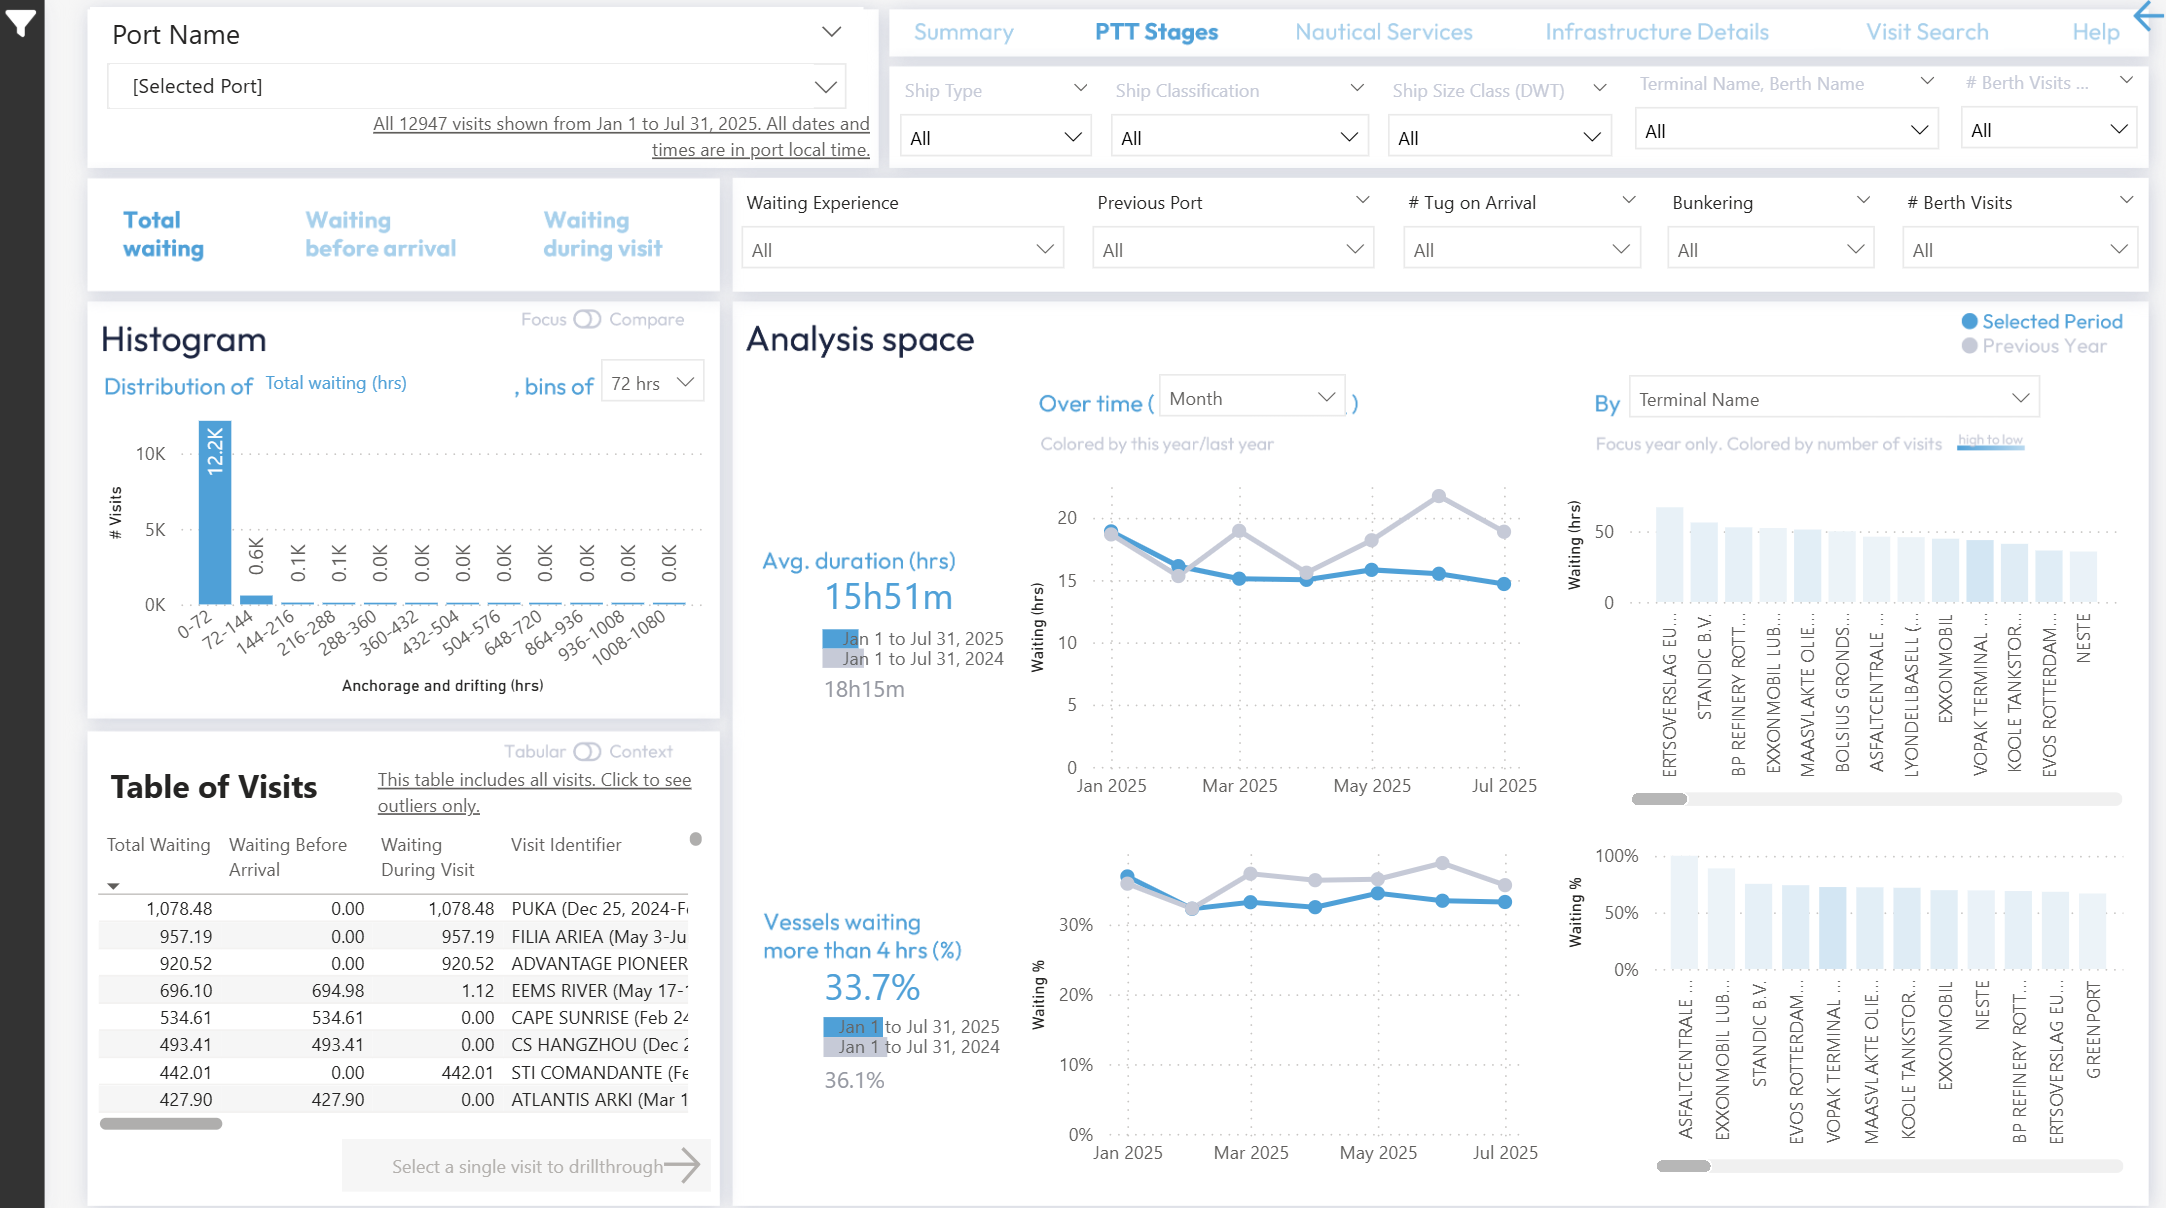
Across all dashboards, filters for time, ship, and terminal allow stakeholders to focus on the exact slice of information they need.
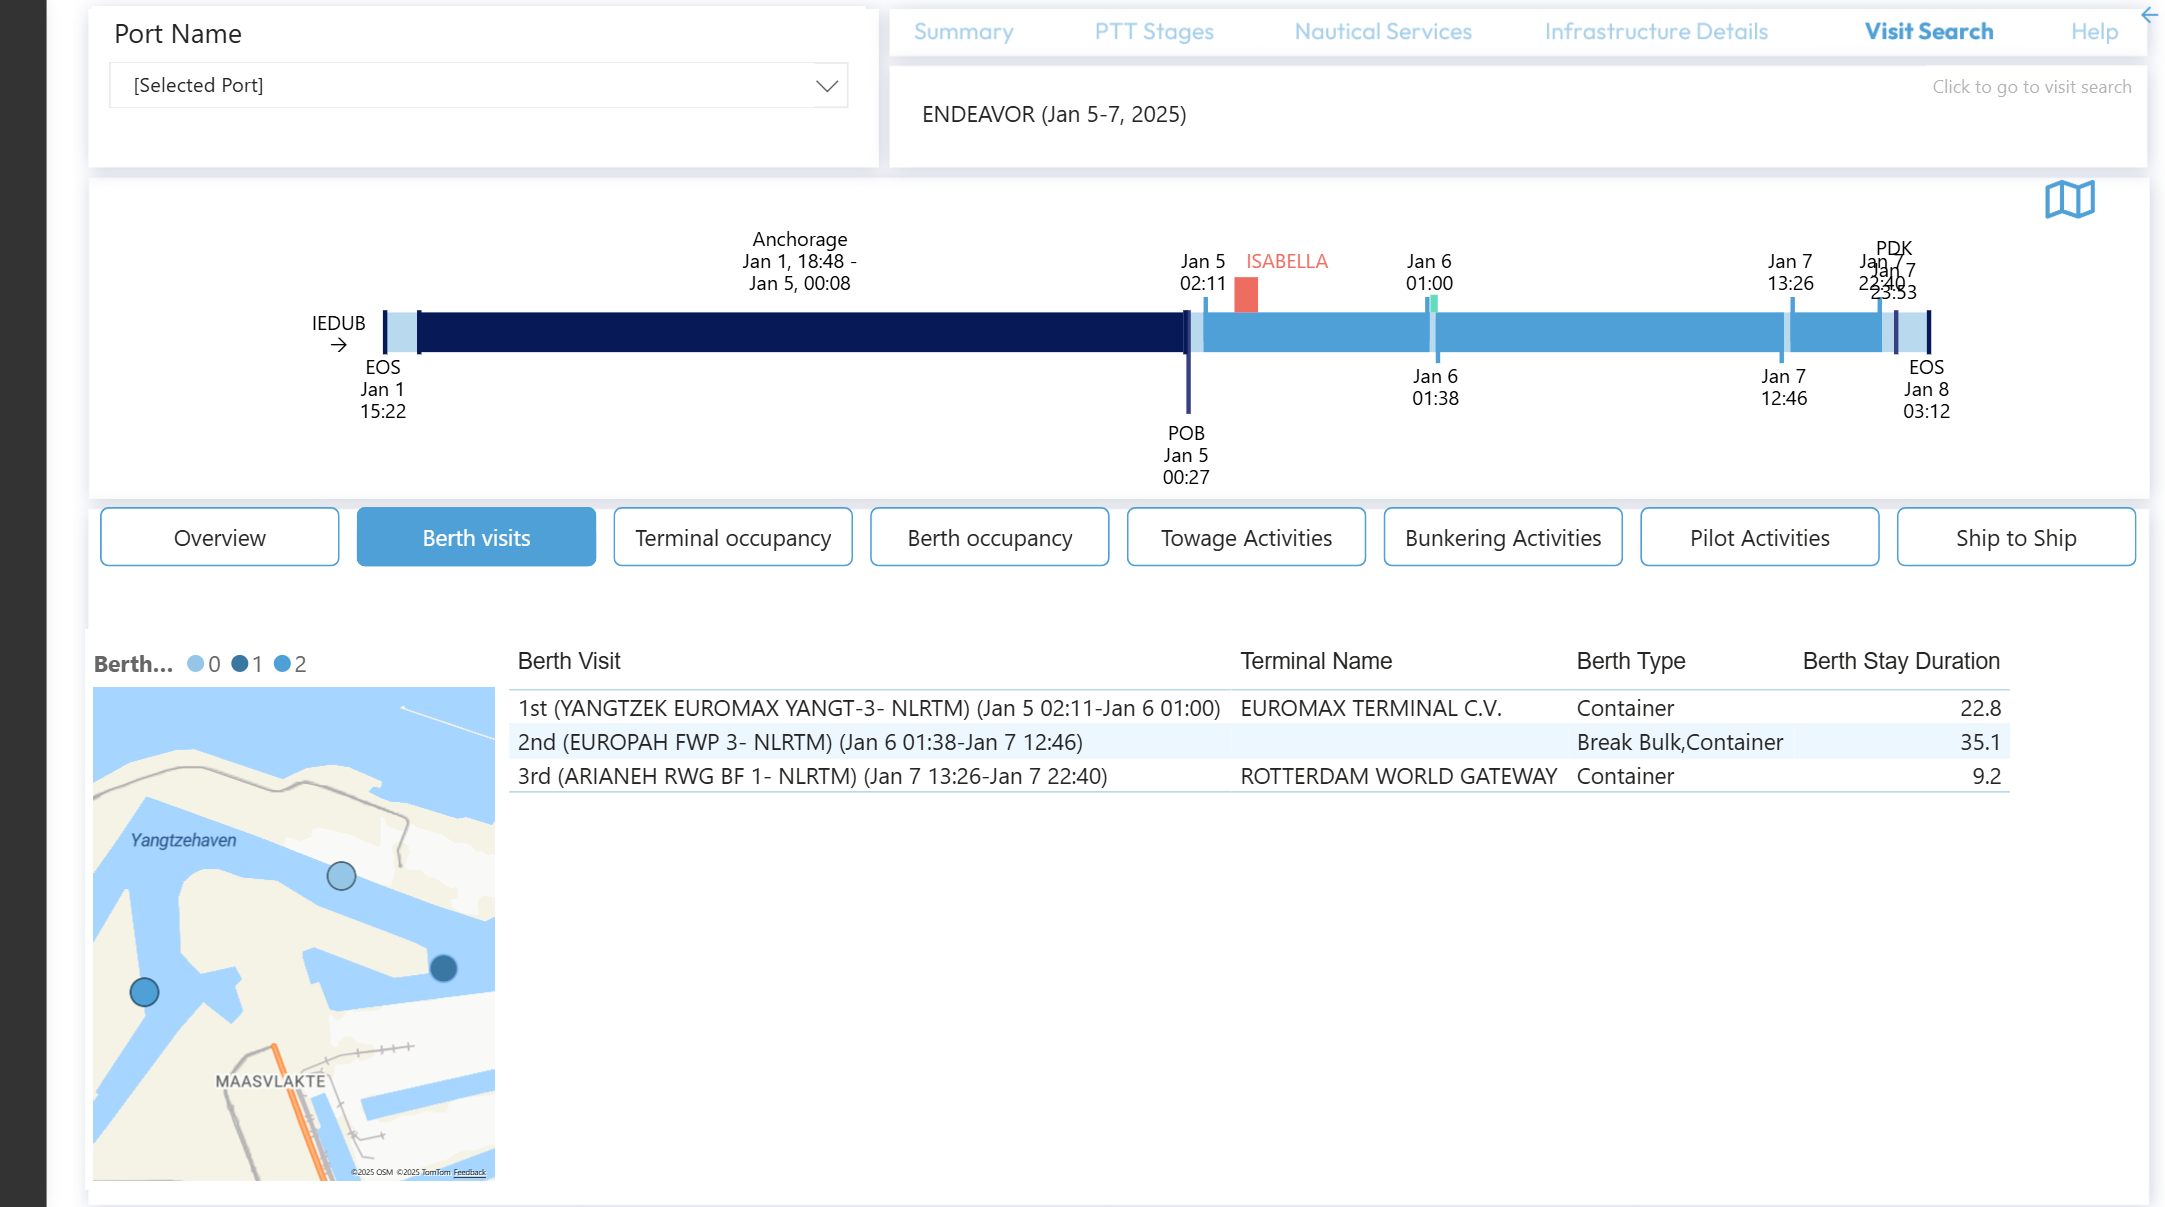
Power BI’s flexibility enables both broad overviews and detailed analysis. At the most granular level, users can drill down to a single vessel call and see precisely what occurred during that visit.
Want to see how these insights are applied in practice? Explore our benchmark reports for a deeper look at data-driven performance across major U.S. ports.
Conclusion
While Teqplay decided to use Power BI for Port Turnaround Optimization dashboard, our research still shows that there is no universal “best” BI tool. The right choice depends on your ecosystem and use cases. Here is our summary:
- Power BI → best for customization and usage insights
- Tableau → best for visual variety and underlying data exploration
- Qlik → best for intuitive, AI-driven analysis and embedded analytics
- QuickSight → best for affordability and AWS-native scalability
At Teqplay, we know that tools are just one part of the equation. The real impact comes when data is translated into actionable insights that expose and eliminate waste, and create value across the maritime ecosystem.
If your organization is exploring how to make better use of data, whether through BI platforms or custom analytics, we’d love to share how Teqplay approaches turning complex data into clarity. Let’s connect!

Léon Gommans | CEO/Co Founder of Teqplay
A serial entrepreneur who’s passionate about #innovation, #technology, #collaboration, and of course, #maritime. The mission is: to connect the dots & to get it to work, together with the industry!
- +31 (0)6 55306660
- leon@teqplay.com
- Léon Gommans