Port Waiting Time: The Hidden Cost Driving Delays, Emissions, and Inefficiency
Waiting time in port is often treated as unavoidable. However, the 2025 U.S. Gulf & East Coast Tanker Ports Benchmark and the Q2 2025 Parcel Tanker Benchmark show that waiting is a measurable performance gap with direct cost, capacity, and emissions impacts.
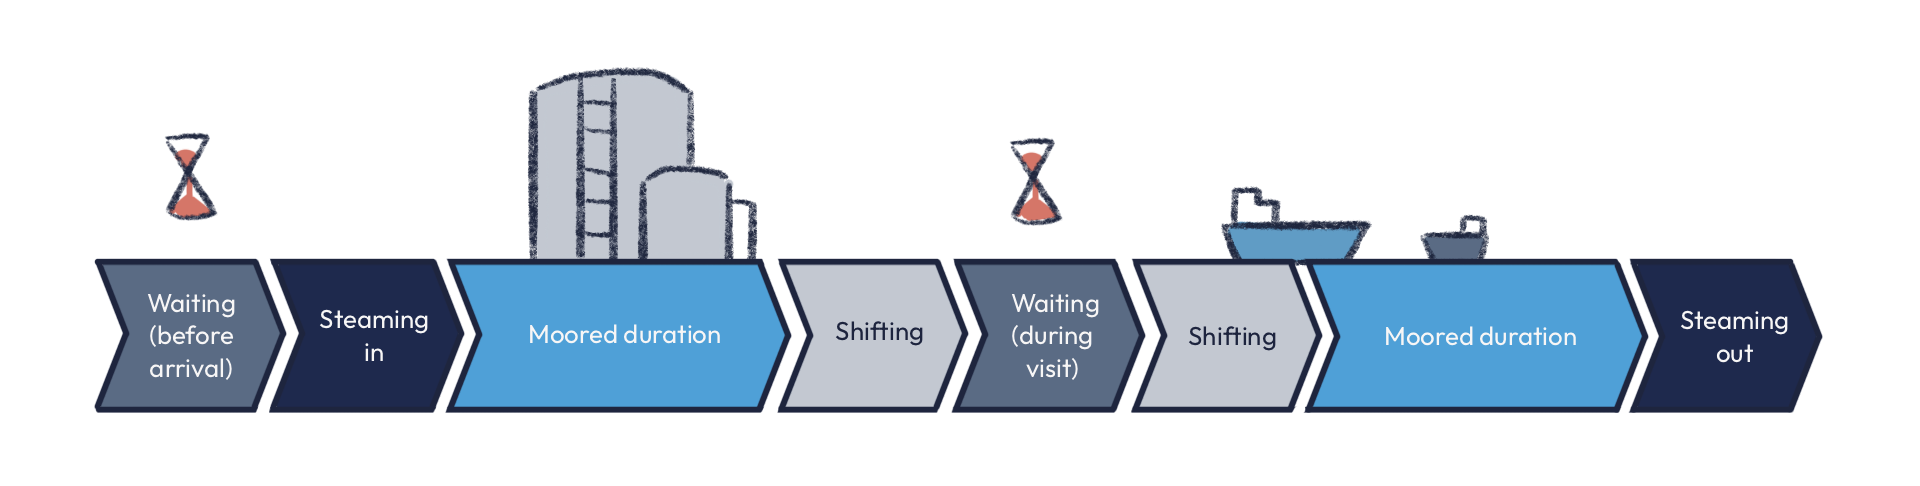
Both reports use Port Turnaround Time (PTT) as a system-level metric. Unlike traditional berth-stay indicators, PTT captures the full port call cycle: waiting before arrival, inbound and outbound movements, shifting between berths, and time moored. This broader lens reveals a clear pattern: only ~45% to 75% of total turnaround time is spent on productive cargo operations . The remainder is largely waiting and shifting.
Waiting before arrival: A challenge of coordination
Across nine U.S. tanker ports, vessels waited on average about 30 hours when berths were available at arrival, but roughly 56 hours when berths were occupied . That 28-hour gap per call highlights a systemic alignment issue between vessel arrivals and berth readiness.
The parcel tanker benchmark reinforces this finding. In Q2 2025, parcel tankers spent around 30 hours waiting before arrival across five Gulf ports . In Houston, this exceeded 1.5 days on average . At one highly occupied terminal, more than ten vessels were recorded at anchorage simultaneously, with some waiting over ten days . These peaks reflect not only capacity pressure but also limited transparency and predictive planning.
Waiting during visit: Complexity multiplies delays
For parcel tankers, complexity amplifies inefficiency. These vessels often serve multiple customers in a single call, shifting between several berths. In the analyzed ports, moored time accounts for only 46% to 67% of total PTT, with waiting reaching up to 45% in some locations .
In Houston and Texas City, vessels are sometimes moved back to anchorage between berth operations . Each movement requires pilots and tugs and extends total PTT without adding cargo value. When more than four berths are involved in multi-port calls between these ports, waiting rises to an average of six days . The broader tanker benchmark confirms that PTT increases sharply as soon as calls involve multiple berths .
Idle time at berth: The hidden layer
Even while moored, not all time is productive. Idle time occurs during setup, tank switching, and closure procedures. With multiple berth visits, these cycles accumulate . Though less visible than anchorage delays, this idle time adds hours, and sometimes days to complex port calls.
Economic & environmental impact
Reducing PTT by one day for a Medium Range tanker can save $18,000–25,000 in charter costs, 15–20 tonnes of fuel, and 50–65 tonnes of CO2 . Parcel tanker examples show potential savings of up to $215,000 when excessive waiting is avoided. Extrapolating these savings to all vessel visits within the year will unlock immense potential for saving costs.
From measurement to action
Both benchmarks point to the same conclusion: waiting is largely coordination-driven. Predictive berth planning, real-time status sharing, just-in-time arrival strategies, and cross-port sequencing can significantly reduce avoidable delays .
Waiting time is itself a performance indicator. By measuring PTT consistently and sharing operational data transparently, ports can reduce inefficiencies, strengthen resilience, and unlock measurable economic and environmental gains.

Léon Gommans | CEO/Co Founder of Teqplay
A serial entrepreneur who’s passionate about #innovation, #technology, #collaboration, and of course, #maritime. The mission is: to connect the dots & to get it to work, together with the industry!
- +31 (0)6 55306660
- leon@teqplay.com
- Léon Gommans