Improve port performance with digital twin insights
The maritime industry is constantly seeking ways to improve operational efficiency, reduce costs, and stay competitive. At Teqplay, we’ve developed a powerful digital twin solution that does more than visualize operations: it enables actionable insights that can significantly enhance performance. In this blog, we’ll explore how data from this digital twin can be used to optimize port turnaround time.
Tracking and benchmarking port performance
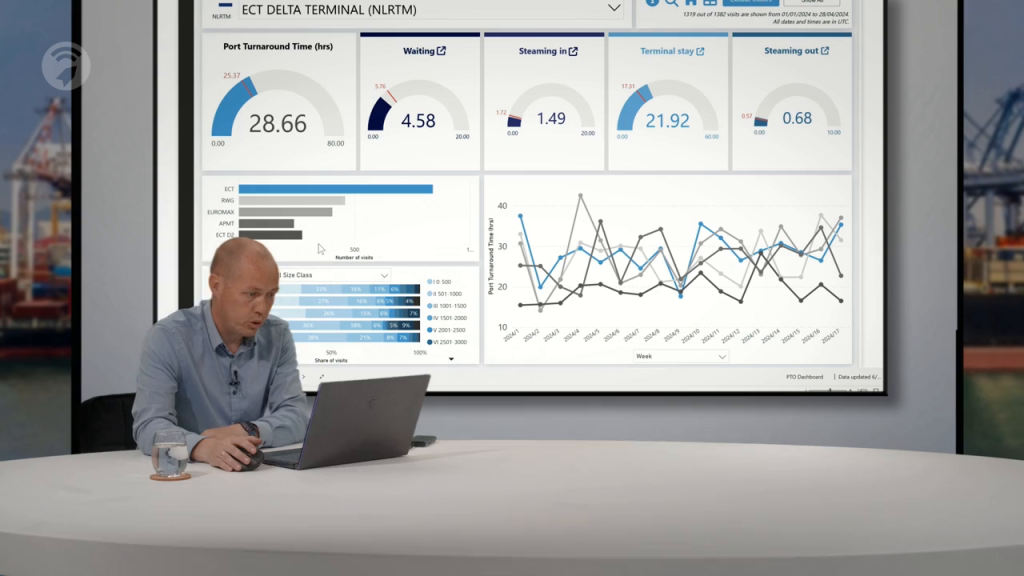
By aggregating timestamps from all vessel calls at a terminal, we’ve created a comprehensive dashboard that calculates the port turnaround time – the duration from a vessel’s entry to its departure. This metric is critical in assessing terminal efficiency.
With the digital twin, the average port turnaround time isn’t just a static number. It also comes with comparative insights, showing how a terminal performs against other competitors.
Teqplay’s digital twin breaks down turnaround time into four key components:
Steaming In: Time from port entry to anchorage or terminal approach.
Waiting Time: Delays before berth access.
Terminal Stay: Duration of loading and unloading.
Steaming Out: Time from departure to port exit.
Among these, waiting time often holds the greatest potential for improvement.
Port turnaround time overview, benchmarked against competitor terminals
Beyond volume: Understanding port call characteristics
It’s not just about how many ships arrive; it’s also about the nature of those calls. The system provides insights into the number of containers handled (call size), vessel size (for instance, how many TEUs the ship can carry), and even the shipping lines involved. This level of detail ensures that comparisons are fair and grounded in operational realities.
For instance, a terminal handling frequent visits from smaller vessels may appear more active, but the actual cargo throughput could be less than a terminal with fewer but much larger ships. Teqplay’s dashboard brings this nuance into focus.
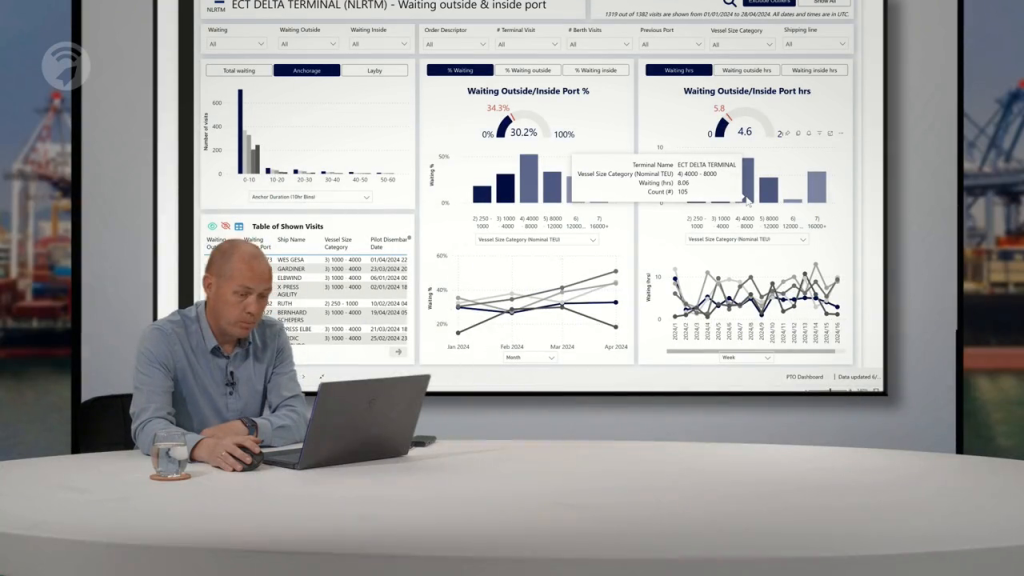
Details about waiting time in & outside port
One standout feature is the in-depth analysis of waiting times. Users can see whether vessels waited at anchorage or in layby, whether the delays occurred inside or outside the port, and which types of vessels were most affected. In an example, the data shows that vessels in the 4000 to 8000 TEU range tend to experience the longest waits.
The data also shows when the terminal performs well in comparison to competing terminals. This kind of insight not only highlights areas for improvement but also validates existing strengths.
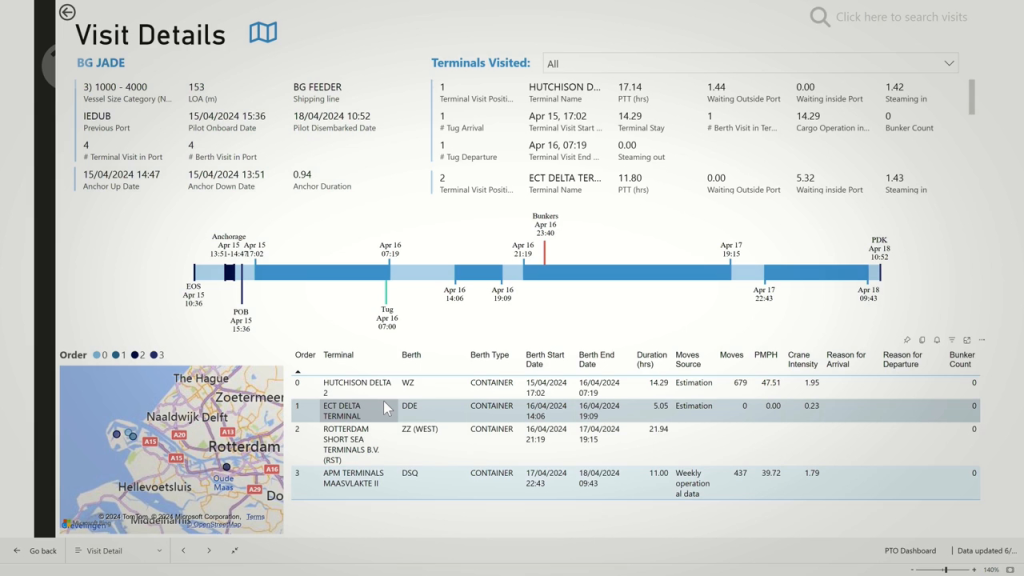
Drill down the details of a port call
Users of Teqplay’s digital twin are not limited to viewing summary data, they can also drill down into individual vessel calls. With one click, they can access all related information: arrival and departure times, waiting duration, berths visited, and more.
This detailed visibility allows operators to identify exactly where time was lost in a specific vessel visit and take action to correct the issues. It transforms abstract KPIs into tangible operational decisions.
Detailed drill-down of a port visit
By turning raw data into understandable, actionable insights, terminal operators can benchmark against competitors, uncover hidden inefficiencies, and continuously improve their operations.
Whether you’re managing a terminal, overseeing port logistics, or optimizing shipping schedules, having a comprehensive overview of what happens in and outside the port helps create a path toward greater improvement.